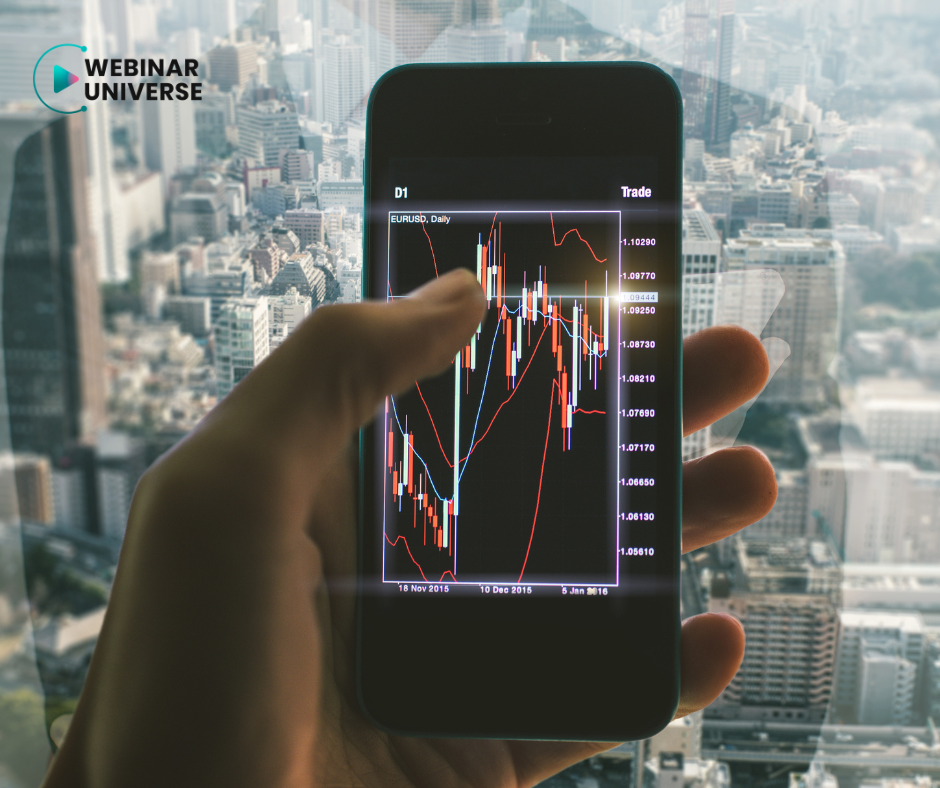
Indicators, that is...
A technical indicator can be described as a certain field of data that is plotted on a chart as a curve, line, histogram or point. Indicators in the case of technical analysis are usually derived from the price rate. Some indicators are non-periodic (e.g. Fibonacci line), others may be derived from volume (e.g. cumulative delta), or from open interest. Such indicators are generally more universal. They are used for many analyses, m.in when estimating trend direction, looking for entry levels, or determining the time of entry or exit. Usually, the indicators are combined either with each other or with a price action reading, or with other analyses. Beginner traders often make the mistake of using as many indicators as possible and combining them in a counterproductive way. This does not increase the chances of a successful transaction at all. On the contrary, a trader may feel overwhelmed by the amount of information they can't even evaluate or contradictory data. Simply put, you only need to use trusted indicators that you understand and be patient. There are no indicators that work in every situation. In addition, it is worth visiting Webinar Universe to understand the issue thoroughly. In the beginning, it is best to choose a broker regulated by a top financial authority, with low commissions.
Indicator – Oscillators
Technical analysis indicators can be divided into several categories within their classification. The term "oscillator" refers to a group of indicators that "oscillate" between certain values, e.g. from 1 to -1. They are used in various ways, e.g. to read divergences, neutral market conditions or to estimate the so-called overbought or oversold. This is because of the universal principle that everything happens in cycles, and extreme values tend to return to normal. The oscillator determines the chance of a correction and makes it easier to make investment decisions. There are more and more indicators of this type, but the most popular ones remain m.in stochastic, MACD or RSI. When entering the Forex market, you need to remember about the most important thing.
Indicator – Momentum
Momentum (MTM) is a key momentum oscillator that compares today's closing price to the closing price from a certain number of days ago (14 periods by default). It is interpreted in a similar way to the ROC oscillator, but unlike the ROC oscillator, the MTM presents the result as a coefficient rather than a percentage. It is also worth presenting its template:
Momentum = C – C(-n) where: C - closing price C(-n) - closing price with n.
In case the value of the oscillator is positive and still growing, as well as has recently reached a new low, a buy signal is formed. When the momentum line is aligned horizontally, it indicates that the price changes over the analyzed period are more or less the same. If, on the other hand, the oscillator has generated a new, local high, after which there is a decline, it indicates a signal to sell. Another way of interpreting involves using the balance level and oscillator indications. A break of zero from below gives a buy signal and a sell signal from above. You can also search for discrepancies between the oscillator indications and the price chart, i.e. the so-called divergences. A bearish divergence is a situation in which successive price peaks are at higher and higher levels, and the corresponding points of the indicator are descending - it informs about possible declines. A bullish divergence is a situation in which successive price lows are at lower and lower levels, and the corresponding points of the indicator are increasing. Of course, in addition to learning the ins and outs of technical analysis, a beginner trader should look at a training platform like Webinar Universe to dig deeper into this topic.

Indicator – Trend Indicator
Trend indicators are good at determining current trends and possibly their changes. There are quite a few of them. However, it is worth mentioning the possible types of trends at the very beginning. An uptrend occurs when the last low is above the penultimate and the last high is above the previous one. A downward low is characterized by the fact that the last high is below the penultimate and the last low is below the previous one. Sideways, on the other hand, occur when local highs and lows reach the same price areas over a given period of time. The most important trend indicators include moving averages, Bollinger Bands, MACD, Zig Zag or Parabolic SAR. Moving averages are a basic indicator in technical analysis. They are created by adding up the closing prices of the underlying instrument from a given period (e.g. several days). The result is then divided by the number of periods of defined time intervals. The MACD is a combination of oscillator functions and moving averages, so it can be used to follow the market. It works best for long-term trades, as it can generate a lot of false signals in the short term.
Parabolic SAR is an indicator that is additionally used to indicate where to close long or short positions. Bollinger Bands had its origins in the 80s of the twentieth century. Bollinger noted that price volatility is dynamic, not static, as everyone thought. The bands define the hypothetical price movement on the chart. There are three lines here - middle (movable), upper and lower. Online brokers often provide access to professional technical analysis tools.
There are many technical analysis indicators, which may seem problematic to novice traders. Fortunately, you don't have to use them all at once - doing so could even be harmful. You should familiarize yourself with the basic categories of indicators and use those that you understand and that will provide reliable information in your situation.
