
Technical analysis, that is...
Technical analysis involves studying the regularity of price movements of a particular asset. This can be done in a variety of ways, however, there are a few of the most popular ones. The first one is technical analysis patterns on price charts. Technicians use drawing tools such as horizontal lines, trend lines, and Fibonacci levels. The patterns highlight the clear strength or weakness of buyers and sellers in the market. Another method is the technical analysis of candlestick patterns. Candlestick charts depict the open, close, high, and low levels of price over a specific unit of time frame to identify suggestions about the behavior of buyers and sellers over a short period of time. Technical analysis indicators signal, for example, when the market is overbought or oversold, or provide clues about the rate of rise and fall. A novice investor should remember to choose a broker whose services will meet their needs. We inform you about how to do it on Webinar Universe. It is necessary to pay attention to the range of trading instruments, types of trading accounts, the quality of order execution, regulatory issues, security of funds or the level of customer service.
There are a few top reasons why you might want to work with technical analysis. It is relatively simple and quick to learn compared to other analytical approaches to the financial markets. It often doesn't require any paid programs or information resources, it allows you to start trading in just a few weeks and gain skills as you go, gradually. It is also versatile - it can be used not only in the Forex market, but also in the case of stock indices, stocks and commodities to cryptocurrencies. It will come as no surprise that trading is a psychologically demanding field. Extreme emotions can significantly worsen the performance of traders. Technical analysis can help with this. It is oriented towards objective numerical data and, in combination with good tools, can ensure maximum objectivity.
The Beginnings of Technical Analysis
Technical analysis of financial markets has been around since markets are driven by supply and demand. The first records of it appeared in the 17th century - it was used by Dutch merchants, and in the 18th century - by Japanese rice merchants. By the end of the 19th century, technical analysis had gained popularity. It was introduced to mass use by the founder and editor of The Wall Street Journal - Charles Dow. The pioneers of the analysis were Ralph Nelson Elliott, the creator of the famous Elliott Wave Theory; William Delbert Gann, creator of Gann's theory, and Richard Demille. It is estimated that Wyckoff was the first psychologist on the market to proclaim that all historical data recorded on a graph is best considered as one mind. For most of the twentieth century and the turn of the century, technical analysis was limited to charting. At that time, statistical calculations of huge amounts of data and indicators were not yet available. Nowadays, in the digital age, the golden age of technical analysis has arrived, so it makes sense to delve a little deeper into it. There are many aspects that a novice investor needs to keep in mind.
Using analysis in the market
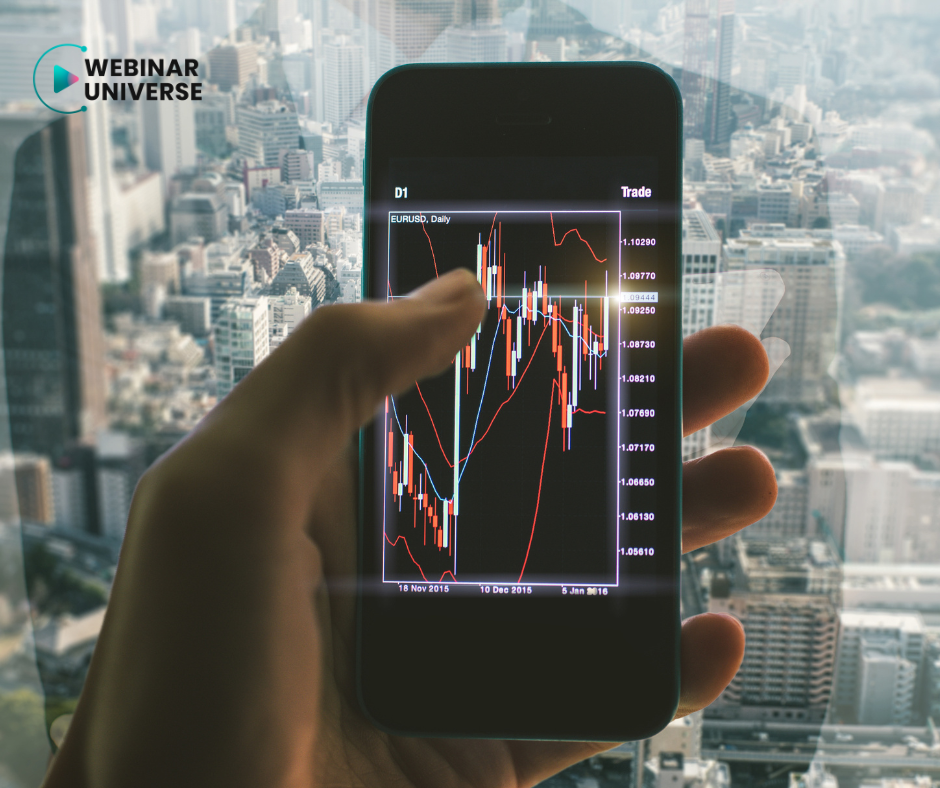
From the training platform, you can learn, m.in, that two groups of tools are used to conduct technical analysis - charts of stock prices in the past and technical indicators. Charts show some graphical patterns that show the evolution of stock prices in the past. They are called technical patterns and show tendencies to recur. In this way, they allow you to forecast the direction of stock price changes in the future. Technical indicators, on the other hand, show the current state of the stock market. Based on the diagnosis of the current state of the market, a forecast for the future is created. Analysis can track, m.in, trends, i.e. the long-term direction of movement of a particular instrument or market. It can be bullish (bullish) or bearish (bearish). The main rule is to always trade in the direction of the trend. Technical analysis also shows S/R (support/resistance) zones. These are significant price levels on the price chart where the price is expected to react in a certain way. This tool assists traders in identifying suitable places to enter the market. The already mentioned candlestick patterns are price movements expressed graphically with candlesticks, on the basis of which it is possible to predict the future development of the situation with a certain probability. Some patterns are formed by a single candle, others by two or more candles.
It is worth remembering that history likes to repeat itself - this is the key word of technical analysis. One method of predicting the future is to analyze previous price movements that take the shape of certain patterns. This approach is based on the assumption that trading is closely related to the calculus of probability. Technical analysis offers traders the opportunity to assess whether a chart is interesting in terms of trade opportunities or not, it indicates how traders can look for a potential setup of factors conducive to entering a trade (look for setups), where to find setups and how to manage them. What else should traders keep in mind? Before making the final choice, it is worth verifying your knowledge and insights with the information contained in the Webinar Universe trainings to make an informed decision.
Technical and fundamental analysis remain the most popular methods of analysis in the market. The advantage of the first one is greater versatility and simplicity. It is sometimes criticized by Forex investors due to its subjectivity, but still the best traders use at least some form of it, usually in combination with other methods.